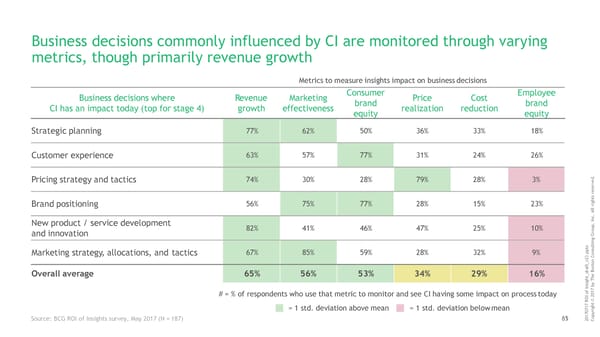
Business decisions commonly influenced by CI are monitored through varying metrics, though primarily revenue growth Metrics to measure insights impact on businessdecisions Business decisions where Revenue Marketing Consumer Price Cost Employee CI has an impact today (top for stage 4) growth effectiveness brand realization reduction brand equity equity Strategic planning 77% 62% 50% 36% 33% 18% Customer experience 63% 57% 77% 31% 24% 26% . Pricing strategy and tactics 74% 30% 28% 79% 28% 3% d ve r e s e r s t h ig Brand positioning 56% 75% 77% 28% 15% 23% r l Al . c n New product / service development I p, 82% 41% 46% 47% 25% 10% u o andinnovation Gr g n i t x l t u p s Marketing strategy, allocations, and tactics 67% 85% 59% 28% 32% 9% p n Co n _v23.o t t f s a r Bo Overall average 65% 56% 53% 34% 29% 16% _de t Th ghy sib n I 7 f # = % of respondents who use that metric to monitor and see CI having some impact on processtoday o I 201 RO© 7 t 1 h = 1 std. deviation above mean = 1 std. deviation belowmean ig r y p Source: BCG ROI of insights survey, May 2017 (N = 187) 35 o 61 201707C
 ROI of Insights | Report Page 61 Page 63