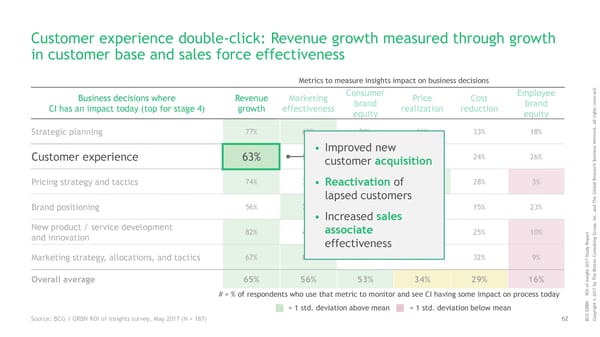
Customer experience double-click: Revenue growth measured through growth in customer base and sales force effectiveness Metrics to measure insights impact on business decisions . d e Consumer Employee v r Business decisions where Revenue Marketing Price Cost e s e brand brand r s CI has an impact today (top for stage 4) growth effectiveness realization reduction t h g equity equity i r l l A . k r Strategic planning 77% 62% 50% 36% 33% 18% o w t e N s • Improved new s e n i s Customer experience 63% 57% 77% 31% 24% 26% u B customer acquisition ch r a e s e R Pricing strategy and tactics 74% 30% 28% 79% 28% 3% l • Reactivation of a b o l G lapsed customers e Th d Brand positioning 56% 75% 77% 28% 15% 23% n a c. • Increased sales n I , p New product / service development u o associate t r 82% 41% 46% 47% 25% 10% r G o and innovation p g e n i R t effectiveness l y u d s u n t Co S Marketing strategy, allocations, and tactics 67% 85% 59% 28% 32% 9% 7 n 1 o 0 t 2 s o t B ghe i s Th Overall average 65% 56% 53% 34% 29% 16% In y f b o 7 OI 1 R 0 # = % of respondents who use that metric to monitor and see CI having some impact on process today 2 - © N B t h g = 1 std. deviation above mean = 1 std. deviation below mean i GRr G y C p Source: BCG / GRBN ROI of Insights survey, May 2017 (N = 187) 62 B Co
 ROI of Insights | Report Page 62 Page 64