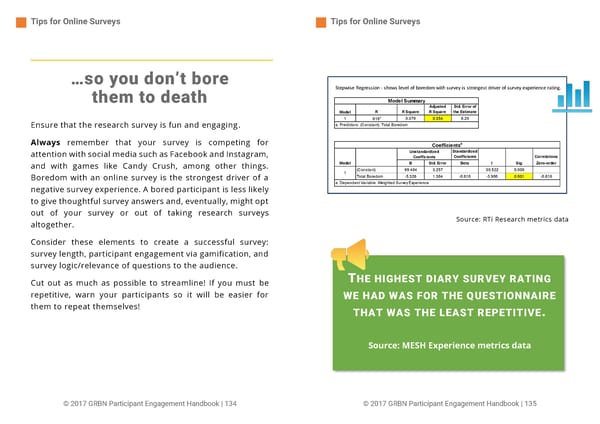
Tips for Online Surveys Tips for Online Surveys 60 …so you don’t bore Stepwise Regression - shows level of boredom with survey is strongest driver of survey experience rating. them to death Model Summary Adjusted Std. Error of Model R R Square R Square the Estimate 1 .616a 0.379 0.354 6.20 Ensure that the research survey is fun and engaging. a. Predictors: (Constant), Total Boredom Always remember that your survey is competing for a Coefficients attention with social media such as Facebook and Instagram, Unstandardized Standardized Coefficients Coefficients Correlations and with games like Candy Crush, among other things. Model B Std. Error Beta t Sig. Zero-order 1 (Constant) 99.404 3.257 30.522 0.000 Boredom with an online survey is the strongest driver of a Total Boredom -5.326 1.364 -0.616 -3.906 0.001 -0.616 negative survey experience. A bored participant is less likely a. Dependent Variable: Weighted Survey Experience to give thoughtful survey answers and, eventually, might opt out of your survey or out of taking research surveys Source: RTi Research metrics data altogether. Consider these elements to create a successful survey: survey length, participant engagement via gamification, and survey logic/relevance of questions to the audience. Cut out as much as possible to streamline! If you must be THE HIGHEST DIARY SURVEY RATING repetitive, warn your participants so it will be easier for WE HAD WAS FOR THE QUESTIONNAIRE them to repeat themselves! THAT WAS THE LEAST REPETITIVE. Source: MESH Experience metrics data © 2017 GRBN Participant Engagement Handbook | 134 © 2017 GRBN Participant Engagement Handbook | 135
 101 Tips to Improve the Research Participant User Experience Page 67 Page 69